Weather is what ultimately powers a soaring flight and that’s exactly the case for Perlan 2. In 2019 Airbus Perlan Mission II started soaring over Patagonia on August 20. Barely over a week later a rare major atmospheric event for the South Pole called Sudden Stratospheric Warming (SSW) was noted.
The previous major SSW in the Southern Hemisphere was 2002, with a minor event in 2010. These SSWs are more common in the Northern Hemisphere. Simply put: this SSW was great for Perlan’s ability to collect science data and not so great for soaring higher in stratospheric waves.
Dr. Elizabeth Austin founder of WeatherExtreme in September 2019 explained:
Currently the Southern Hemisphere is experiencing a rare event, sudden stratospheric warming (SSW). A sudden stratospheric warming event is considered to be occurring when there is sudden warming of the polar stratosphere without any obvious external source. These events can warm the polar stratosphere by as much as 10 degrees Celsius (18 degrees Fahrenheit) per day within a week, reversing the normal north-south temperature gradient that the polar vortex requires to maintain strength.
The polar vortex is believed to be a key driver of tropospheric weather and climate patterns. SSW’s are more common in the Northern Hemisphere as there is more land mass which allows the troposphere to interact more directly with the stratosphere. Here in the Southern Hemisphere the last know SSW took place in 2002.
As we do not know the exact cause of SSW and have a lack of meteorological observations in the Southern Hemisphere, the scientific community is lucky to have the Perlan II in an active campaign on location during this event. The Perlan II has the capability to fly into the stratosphere and take direct measurements of temperature fluxes and changes in wind speed and direction that are directly related to SSW.
These sudden stratospheric warmings are poorly resolved in climate and weather models but are believed to have a large effect on Southern Hemispheric climate-sensitive circulations, such as the polar vortex. Atmospheric measurements collected by Perlan II will help to better resolve the causes and effects of sudden stratospheric warming and allow for weather and climate modelers to more accurately predict their occurrence and interactions with global and regional systems.
On the importance of SSW Dr Austin added in October:
The sudden stratospheric warming (SSW) occurring over the Antarctic region may be one of the strongest on record. There was another strong one in September of 2002 and a weaker one in September of 2010 although some scientists do not think that the September 2010 event qualifies as a SSW event.
These are most likely caused from enhanced energy propagating from the tropospheric planetary-scale waves….It is extremely significant especially since the current event seems to be even stronger than the 2002 event (which was a strong one). These SSW events set certain weather and climate responses in motion, so to speak, and we know a lot more about these now than we did back in 2002. Some of these things include it’s impact on the polar vortex (significant weakening), on the Antarctic sea ice (enhanced decline), on the ozone hole (helps repair it), on the weather in Australia and New Zealand, just to name a few. The SSW also influences some of the major climate drivers like the Indian Ocean Dipole (IOD). The IOD is one of the key drivers of Australia’s climate and thus SSW’s.
Perlan’s balloon team leader and PhD student Stormi Noll said: The warmer air is affecting flight opportunities because it is weakening the polar night jet by weakening the temperature gradient its strength relies on.
Perlan’s onsite meterologist Dan Gudgel wrote: The data from any Perlan flights as well as the RAOB collection by the Perlan Balloon Team’s 29 balloons provide observed atmospheric parameters that the research community will relish in an otherwise data-deficit area of the globe. The irony is that this portion of the world plays a very important role in the energy budget of the atmosphere and yet…even with the importance of the Polar Night Jet and other stratospheric activity over the South Pole…there is minimal weather atmospheric data available from the Southern Hemisphere. While the current and unusual Sudden Stratospheric Warming (SSW) event is working against Perlan’s ability to soar in the stratosphere…the opportunity that this timely Perlan encampment provides will benefit with observed atmospheric data those academic and research communities who wish to delve into the unknowns surrounding the event and its potential ramifications for climate change.
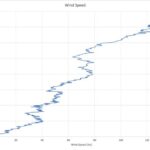
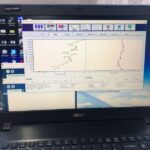
From Michael Batalia and Jim Payne: The weather balloon’s actual measured data showed stratospheric winds died back in layers at high altitudes on many days. For instance on September 18 and 19 at 40,000 feet the winds were 80 knots, yet at 60,000 feet the balloons measured only 45 knots of wind. Jim said that ideally winds would be 100 – 120 knots at 60,000 feet for good stratospheric wave lift. These bands of decreasing wind seemed to cap the lift that Perlan 2 needed to climb. And these layers seemed related to the forecast models showing severely tilted (even almost horizontal) lift tubes which ideally would be almost vertical.
From Jackie: The Perlan 2 needs a wave elevator (vertical lift tube) not an escalator (nearly horizontal lift band). The escalator isn’t powerful enough to overcome the true airspeed sink rate. The slowing of the wind is like the escalator topping out – time to get off. It’s not likely to take you any higher.
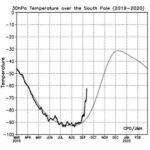
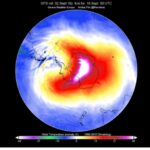
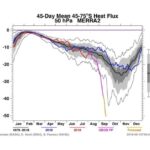
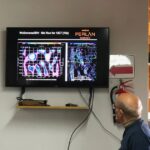
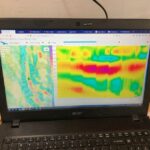
In the blog photos: The map forecast was for September 16, The Sky Sight horizontal “lift tubes” was on September 17 (actual flight to a hard-earned 65,000 foot – only 600 feet short of second highest soaring flight in the world), the balloon wind speed graphs were on September 14 and 17, the Japanese stratospheric temperature graph was mid September, and the NASA chart was mid September.
Thanks to Dr. Elizabeth Austin founder of WeatherExtreme and Chief meterologist with Perlan 1 and Perlan 2, Dr. Jim Means – Physics California State University San Marcos, Dan Gudgel – 35 years at National Weather Service, Walt Rogers – LA Center of National Weather Service over 40 years, Stormi Noll – PhD student in atmospheric science University of Nevada Reno, and Matthew Scutter founder of SkySight for sharing links, sharing text books, and helping with this blog. Thanks to Armistead Sapp for amazing computer support for the weather team and for me. Any mistakes or over simplifications are mine. Perlan Soars! Jackie
The Perlan weather balloon data is publicly available at http://www.perlanproject.cloud/data/Balloon%20Soundings/
Below are several links and credits about the SSW that were shared by our experts:
https://scitechdaily.com/weathering-antarctic-storms-and-the-importance-of-weather-balloon-data/
https://www.youtube.com/watch?v=VnlFFaF_l7I
https://www.metcheck.com/SEASONAL/stratosphere_forecasts.asp nice charts of the vortex
https://www.newshub.co.nz/home/new-zealand/2019/08/weather-niwa-warns-sudden-stratospheric-warming-will-peak-on-friday.html
http://www.severe-weather.eu/recent-events/stratospheric-warming-ozone-hole/
http://www.severe-weather.eu/mcd/sudden-stratospheric-warming-antarctica/
Tokyo Climate Center, Japan Meteorological Agency (graph photo)
NASA Goddard Space Flight Center (chart photo)
Severe Weather Europe (map photo)